100 Hours
From World-Famous Traffic to World-Renowned Solutions
The average LA driver now loses over 100 Hours every year trapped in traffic, making LA one of the most highly congested cities in the world. Angelenos agree: it’s time to get serious about solving our record-breaking traffic problems. The 100 Hours Campaign was launched to bring together solutions from around the world and start a real conversation about what it will take to turn traffic hot spots into models of mobility.
It’s time to have a real conversation about what it will take to get Los Angeles moving again. We’ve compiled solutions that have been proven to work in the greater Los Angeles region and around the world, and will soon add more ideas from thought leaders and transportation experts.


Existing Conditions
The average LA driver now spends over 100 hours every year stuck in traffic. That number is climbing quickly and stands as some of the worst traffic in the entire world. The time we waste costs us each over $2,400 in lost productivity and fuel, to say nothing of the personal sacrifices and complicated life decisions we make every day just to avoid traffic.
For example, see Olympic Blvd above. As this video model demonstrates, current traffic conditions during rush hour are a nightmare, leaving commuters trapped while trying to get on the 405 or just passing through the Westside.
What would happen if we took the best solutions from above and combined them together to form a “Go Zone,” with the goal of reducing traffic congestion in some of LA’s worst traffic hot spots?
Go Zone
This video models the impact of possible near-term solutions in Los Angeles combined together to form a “Go Zone,” to relieve congestion and get traffic hot spots like Olympic moving again.
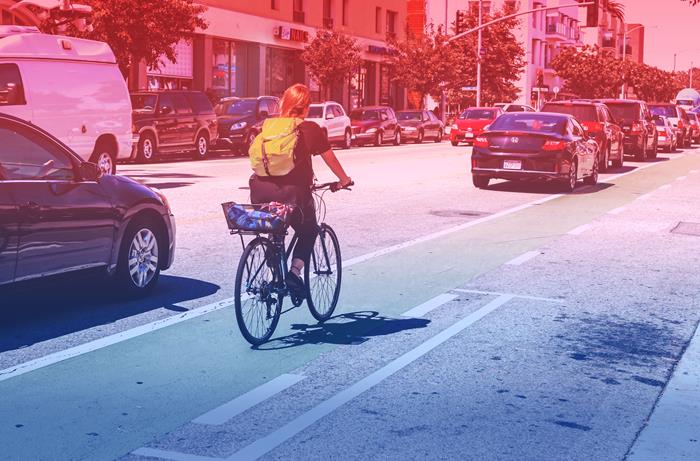
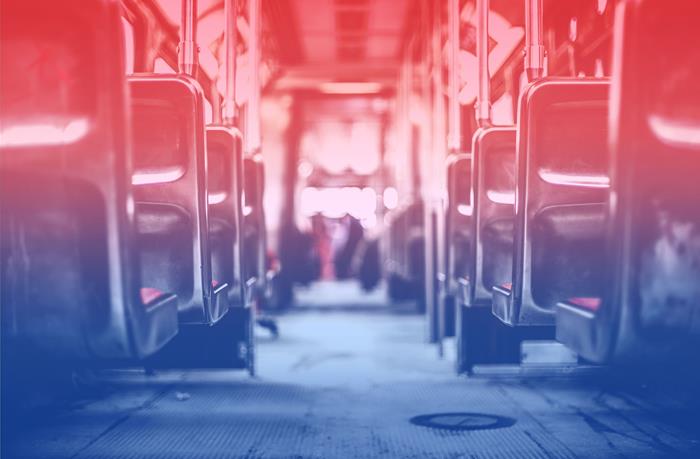
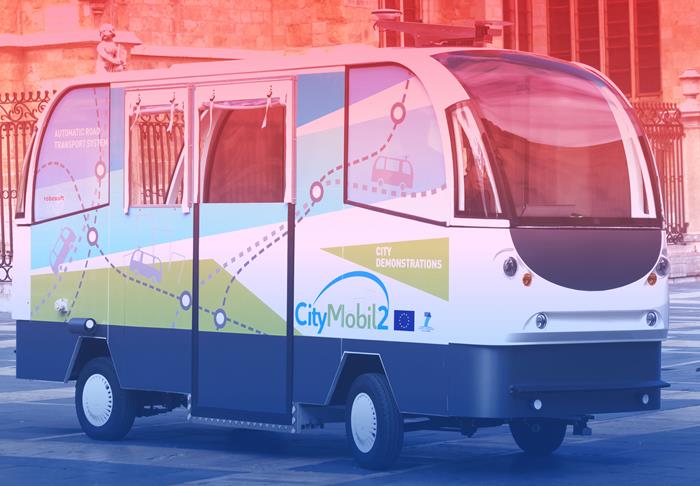
These solutions, which include a decongestion fee system during peak traffic hours, increased incentives for ridesharing, more frequent and reliable transit options, and better crosswalks and bike lanes to make walking and cycling safer and more enjoyable, have been proven to enhance mobility in cities around the world.
Together, these mobility innovations can do more than improve traffic conditions, they fundamentally transform our streets to move us past a “drive-it-alone” model of transportation.
The January 2021 Executive Director’s Report covers the agency’s major activities, key programs, and accomplishments over the past two months.
Joint Policy Committee Holds Panel Discussion on Regional Resilience
As Southern California grapples with the destruction caused by January wildfires, SCAG is committed to supporting local agencies in the collective work of recovery and resilience.
The February 2021 Executive Director’s Report covers the agency’s major activities, key programs, and accomplishments over the past month.
The March 2021 Executive Director’s Report covers the agency’s major activities, key programs, and accomplishments over the past month.
The April 2021 Executive Director’s Report covers the agency’s major activities, key programs, and accomplishments over the past month.
The May 2021 Executive Director’s Report covers the agency’s major activities, key programs, and accomplishments over the past month.
The June 2021 Executive Director’s Report covers the agency’s major activities, key programs, and accomplishments over the past month.
The July 2021 Executive Director’s Report covers the agency’s major activities, key programs, and accomplishments over the past month.
The September 2021 Executive Director’s Report covers the agency’s major activities, key programs, and accomplishments over the past month.
The October 2021 Executive Director’s Report covers the agency’s major activities, key programs, and accomplishments over the past month.
The November 2021 Executive Director’s Report covers the agency’s major activities, key programs, and accomplishments over the past month.